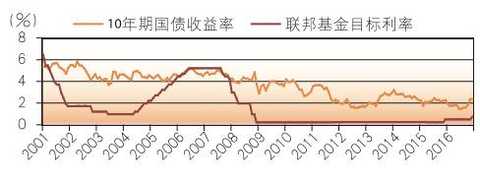
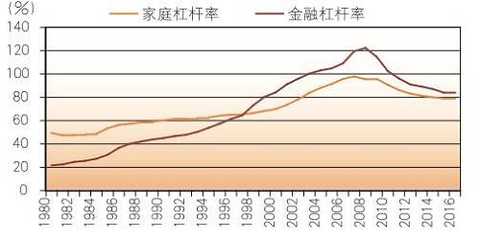
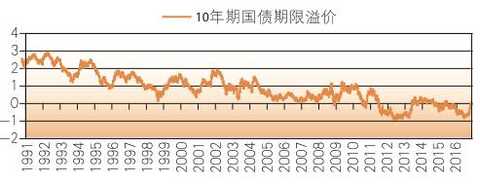
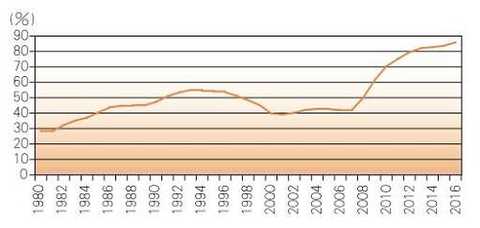
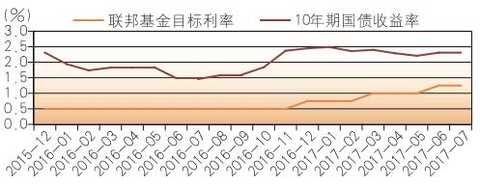
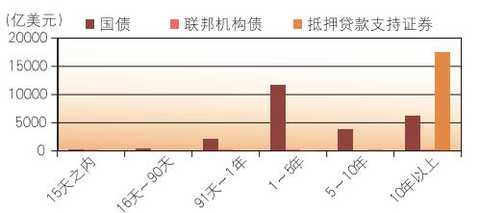
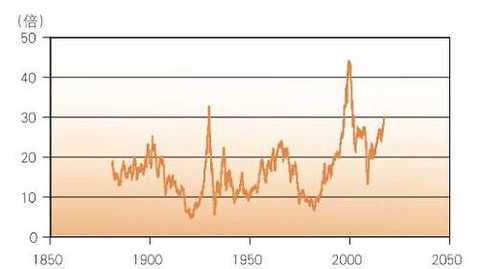
This article was first published on the WeChat public account: Banker Magazine. The content of the article belongs to the author's personal opinion and does not represent the position of Hexun.com. Investors should act accordingly, at their own risk. From 2004 to 2005, while the Federal Reserve raised the federal funds rate, the long-term interest rate in the United States has remained stable or even declined. This is called the "Greenspan Mystery." The excess liquidity and the "Greenspan Mystery" stimulated the US real estate bubble and eventually led to the outbreak of the subprime mortgage crisis. After the financial crisis, in order to overcome the "Bernanke problem" and "zero interest rate lower limit" issue, the then Fed chairman took a non-conventional monetary policy such as a large-scale asset purchase plan, which once again caused a situation of excess liquidity in the United States. With the gradual recovery of the US economy, the Fed began to accelerate the pace of interest rate hikes, and considered "shrinking the table," but for various reasons, the size of the Fed's contraction will be limited. This means that the United States will continue to maintain ample liquidity or excess in the future, leading to the recurrence of the "Greenspan Mystery". "The Mystery of Greenspan" and Its Causes Since the mid-to-late 1980s, central banks in developed countries have generally achieved the goal of macroeconomic regulation by regulating short-term interest rates. The central bank regulates short-term interest rates and can influence long-term interest rates through market arbitrage mechanisms, which in turn affects the real economy. For example, in the period of “Greater Relaxation†from 1985 to 2001, every 1% increase in the federal funds rate increased the yield of 10-year government bonds by about 38 BP. Although the long-term interest rate rise is far less than the short-term interest rate, it can still basically guarantee the effect of monetary policy and avoid the impact of excessive long-term interest rate fluctuations on the economy. The reason is not difficult to understand: short-term interest rates more reflect the cost of borrowing money, and long-term interest rates are more determined by the economic fundamentals of economic fundamentals and inflation expectations. The central bank's increase in short-term interest rates has its own role in curbing credit expansion and thus curbing economic growth and inflation. It is expected that the slowdown in economic growth and the decline in inflation will naturally lower long-term interest rates. However, from 2004 to 2005, the Fed raised the federal funds rate, while the long-term government bond yield remained relatively unchanged or even declined. This is called the "Greenspan Mystery", also known as the "mystery of interest rates" ( Bond Conundrum) (Figure 1). Figure 1 US federal funds target interest rate and 10-year government bond yield According to the liquidity premium theory in the interest rate term structure theory that compares the actual situation of the yield curve, the long-term interest rate is equal to the sum of the expected future short-term interest rate average and the term premium. Therefore, in the current short-term interest rate increase, long-term interest rates remain stable or even decline, there may be two reasons: First, although the current short-term interest rates increase, but the market is more pessimistic about the economic outlook, it is expected that future short-term interest rates will continue to rise It is not sustainable. Second, the time-varying term premium has dropped significantly. Considering that the entire world economy, including the US economy, grew strongly from 2003 to 2007, and the increase in energy prices led to increased inflationary pressures, the "Greenspan Mystery" of 2004-2005 should be mainly a time-varying term premium. The decline was caused. For reasons of the decline in the time-varying term premium, Bernanke believes that it is caused by excess savings in emerging market countries. Economic Adviser concluded in a 2005 survey of clients: foreign central bank purchases of US Treasury bonds, increased demand for pensions, higher-yield bond investment strategies, reduced inflation risks, increased Fed transparency, global savings Excess and the increase in US economic stability are the top seven factors that lead to a period premium and a reduction in long-term interest rates. But the above explanation is unpredictable and ignores a more fundamental factor: the Fed’s monetary policy under the “dollar powerâ€. As the most important international reserve currency, the US dollar has attracted emerging market countries to pursue the US dollar. In order to ensure the security and liquidity needs of the US dollar foreign exchange, emerging market countries have to purchase large amounts of long-term national debt. Moreover, the "dollar power" allows the Fed to more easily use monetary policy to stabilize financial markets and macroeconomics. After Greenspan took over the Fed, he adopted an attitude of neglecting the asset bubble, but once the financial crisis broke out, the Fed would promptly play the role of the lender of the last lender. This was the “share disaster†in October 1987 and the long-term capital management in 1998. The bankruptcy of the company, the bursting of the Internet bubble in 2000, and the "9.11" incident in 2001 were all reflected. This is called the “Greenspan Countermeasureâ€, which gives the market a “Greenspan Put Optionâ€. After the dot-com bubble burst, the Fed implemented a three-year loose monetary policy and promised to provide sufficient liquidity to financial institutions. This makes the financial market more abundant, and the volatility of financial assets is reduced, and the stability of the economy is greatly increased. Moreover, the “Greenspan Countermeasure†has enabled the financial sector to accelerate financial innovation, obtain financing through the issuance of short-term securities, and carry out “long-term†leveraged and prolonged investment behaviors to transform short-term assets into long-term assets. Eventually evolved into a situation of excess liquidity, further reducing the term premium, resulting in the "Greenspan mystery." The New Palgrave Economics Dictionary defines liquidity from the perspective of the financial asset maturity curve. The so-called financial asset maturity curve is a curve that combines the size of financial assets with the remaining maturity of financial assets. The horizontal axis is the remaining maturity period and the vertical axis is the scale of financial assets. Peng Xingyun further defined the situation of excess liquidity according to the change of the financial asset maturity curve: under the current interest rate and asset price level, the short-term financial assets held by market participants exceed the equilibrium level they are willing to hold, while the medium and long-term assets It is also below the reasonable level of its will, so the market entity will adjust the asset structure and convert more short-term assets into long-term assets. Therefore, when liquidity is abundant, the liquidity premium will be small, and sufficient liquidity will encourage investors' risk appetite and naturally reduce the risk premium. In the case of excess liquidity, the liquidity premium and the risk premium are particularly declining, people's liquidity preference will decline, and even “liquidity aversion†will occur. This performance on the financial asset maturity curve is that the maturity curve will be further flattened, which will result in a significant decline in liquidity premium, risk premium and term premium. This will lead to a decline in long-term interest rates, a narrowing of the term spreads and a flattening of the yield curve. This reduces the term premium of long-term government bonds, and at the same time, market players will adopt leverage to increase the rate of return. We can also see that after 1998, encouraged by the “Greenspan Countermeasureâ€, the leverage of the US financial sector has risen rapidly; after 2001, under the stimulus of the real estate bubble, the leverage of the US household sector has also risen sharply ( figure 2). Moreover, after 2001, the 10-year Treasury yield rate premium also showed a significant decline (Figure 3). Figure 2 US household sector and financial sector leverage Figure 3 US 10-year government bond yield limit premium Unconventional monetary policy once again caused excess liquidity The Greenspan strategy has exacerbated financial risks while promoting short-term economic stability. The long-term low interest rate policy, excess liquidity and the decline in the term premium have contributed to the US real estate bubble before the subprime mortgage crisis. The liquidity of the remaining shadow banking system has strengthened this effect. The monetary policy with open market operations as the main tool can not correctly identify the excess liquidity and the risk under the shadow banking system, which leads to the accumulation of risks. For this, Minsky has long said: "In the funding of banks, an important change has occurred since the 1920s, that is, the relative importance of Fed discounting and open market operations has been reversed. If the Fed passes If the discount window is operating normally to provide funds to the bank, as long as the commercial banks value this source of funds, they will comply with the regulations of the reserve bank and the balance sheet, and if the public debt is operated through the government bond, it will provide liquidity to the bank. Sex, the buying and selling relationship between the Fed and member banks has caused the Fed to lose its ability to influence the behavior of member banks." The excess liquidity and the stability of long-term interest rates have further stimulated the economy, but also blocked the transmission of monetary policy and encouraged market risk appetite, which further stimulated the real estate bubble. The asset bubble on the basis of high leverage eventually led to the outbreak of the global financial crisis. After the outbreak of the financial crisis, the original excess liquidity quickly turned into a liquidity crisis and even a liquidity crisis, which led to a significant increase in the term premium, which in turn triggered the “Bernanke problemâ€. The so-called "Bernanke problem" refers to the fact that after the financial crisis broke out, the Fed quickly lowered the federal interest rate to near zero interest rate, but the long-term interest rate declined very limitedly. Like the “Greenspan Problemâ€, liquidity has also played a crucial role in the “Bernanke Problemâ€: after the crisis broke out, financial assets under “crowded transactions†were caused by the sharp fall in prices of various financial assets. The liquidity is rapidly lost, the risk premium and the term premium are greatly increased, so the long-term interest rate has remained relatively stable in the case of a sharp drop in short-term interest rates. In response to the "Bernanke problem," then Federal Reserve Chairman Ben Bernanke had to reverse the operation and several rounds of quantitative easing to reduce long-term interest rates and stimulate credit recovery after the short-term interest rate was reduced to zero interest rate. It also increased the issuance of government bonds to stimulate the economy. The mechanism of reverse operation and quantitative easing is to reduce the term premium by reducing the term premium by the central bank's large-scale re-investment of national debt, especially long-term national debt, to reduce the long-term interest rate. Since treasury bonds are the safest and most liquid financial assets of a country, the large-scale issuance of treasury bonds, on the one hand, stimulates economic financing, and on the other hand, improves market liquidity. This has led to a sharp expansion in the size of the Fed’s balance sheet and a rapid increase in the leverage of the US government. Among them, the size of the Fed’s balance sheet expanded from about $0.9 trillion before the crisis to about $4.5 trillion at the end of the volume, and the leverage of the US federal government rose from about 40% before the crisis to about 85 today. %(Figure 4). This shows that after the short-term interest rate fell to the zero interest rate level and suffered the “zero interest rate lower limit†issue, the Fed realized the regulation of the entire government bond yield curve through unconventional monetary policy. Figure 4 US federal government leverage It can be seen that since the implementation of the quantitative easing policy, the 10-year US Treasury yield rate premium and the 10-year government bond yield have both dropped significantly. Surprisingly, the 10-year Treasury yield rate premium has even experienced a long-term negative after 2011. This shows that the Fed’s unconventional monetary policy has caused market players to once again create a “liquidity surplus†situation, and even “liquidity aversionâ€. "The Mystery of Greenspan" may be repeated In the case of “excess liquidity†or even “liquidity aversionâ€, the risk appetite of market entities will be strengthened, and the purchase of long-term national debt and risk assets will be increased, which will inevitably lead to three changes in US financial assets: long-term government bond yields will Maintain historical lows; the stock market has reached record highs in the case of low volatility; real estate prices continue to rise. At the expense of the expansion of the Fed’s balance sheet and the deterioration of the US federal government’s balance sheet, the balance sheets of the US family, business and financial sectors have improved and the economic recovery has gradually been realized. With the gradual recovery of the US economy, the Fed also began the process of normalizing its monetary policy. The Fed raised the federal funds target rate of 25 BP in December 2015, December 2016, March 2017, and June 2017. But it is worth noting that although the federal funds rate has increased by 1 percentage point, the yield on the US 10-year government bond remains stable. Since the Fed’s first interest rate hike in December 2015, the 10-year bond yield has experienced roughly three stages: from the end of 2015 to September 2016, after the Fed’s first rate hike, the 10-year bond yield has appeared. The decline was from about 2.3% at the end of 2015 to 1.5% in September 2016; during the period from October 2016 to the end of 2016, President Trump promised to carry out a large-scale fiscal stimulus plan during the campaign. Increased market economic growth and inflation expectations, leading to a sharp rise in 10-year Treasury yields; since 2017, due to the delay in the introduction of Trump’s fiscal stimulus, the 10-year Treasury yield has been raised twice in the Fed. The situation is still oscillating, down from about 2.5% at the beginning of the year to about 2.2% today. At present, after four interest rate hikes, the 10-year bond yield remains at the level before the rate hike (Figure 5). Therefore, we can think that the "Greenspan Mystery" has been repeated. Combined with our previous analysis of the reasons for the "Greenspan Mystery", we also have reason to believe that it is the current loose or even excess liquidity situation in the United States that led to the re-enactment of the "Greenspan Mystery." Figure 5 Federal funds' mark rate and 10-year bond yield since the Fed raised interest rates Due to the gradual recovery of the US economy and the continuous rise of the US stock market, the Fed began to consider "shrinking the table" for the purpose of maintaining macroeconomic stability and financial stability. For the “reduction of the table†strategy, the Fed has already discussed in the “Principles and Plans for the Normalization of Monetary Policy†promulgated in September 2014, suggesting that the Fed will be held mainly by stopping or reducing its Open Market Operating Account (SOMA). The securities' maturity principal is reinvested and will not actively sell MBS. In the minutes of the Federal Open Market Committee meeting on March 1, 2017, most members believed that if the economy continued to move in the expected direction, the Fed would continue to raise interest rates gradually and begin to shrink in a passive and predictable manner. Passive means that SOMA does not actively sell the securities it holds, but will automatically resume the principal after it expires and will not continue to invest; predictable means that the Fed should communicate to the market in advance when the time and intensity of the contract is reduced. In addition, in order to reduce the impact of the contraction on the financial market, the reinvestment of the maturity of the maturity will adopt a gradual reduction strategy rather than a complete end immediately after expiration. In general, the Fed will scale down in a passive, gradual, and predictable manner based on an assessment of the economic and financial situation. The details of the “shrinking table†were further discussed, and it was proposed that the Fed began to “shrink the table†when the normalization of the federal funds rate reached a certain level. For maturing national debt, the Fed expects to initially reduce its reinvestment by $6 billion a month and increase it by $6 billion every three months in a year until it is cut by $30 billion a month. For maturing institutional and mortgage-backed securities, the Fed expects to initially reduce its reinvestment by $4 billion a month and increase it by $4 billion every three months in a year until it is cut by $20 billion a month. However, due to the small size of the federal institutional debt held by the Federal Reserve and the maturity of mortgage-backed securities for more than 10 years (Figure 6), the Fed’s initial “reduction†will be reinvested by cutting the principal of the maturing government bonds. Mainly. That is to say, within one year after the “reduction of the tableâ€, the size of the Fed’s “shrinking the table†is about 200 billion U.S. dollars. In the 2 years after the “reduction of the tableâ€, the size of the Fed’s “reduced table†is about 600 billion U.S. dollars. Figure 6 The term structure of the Fed currently holding securities At the same time, the size of the Fed's final “shrinkage†may be very limited for the following reasons: First, the low interest rate environment has increased cash requirements. The US natural interest rate has been declining since the 1970s and is currently down to the level of 0.5% to 1%. Considering the 2% inflation target, according to Taylor's Law, the equilibrium level of the federal funds rate is about 2.5% to 3%. Below the pre-crisis level. Since the demand for cash in circulation is inversely proportional to the nominal interest rate, the current low nominal interest rate increases the demand for cash in circulation. In 2007, cash in circulation was about $0.8 trillion, and New Zealand Federal Reserve staff believes it has increased to about $1.5 trillion, and may increase to $2.5 trillion in the next 10 years. Second, the Fed’s new monetary policy framework requires a larger balance sheet size. First, the improvement of the interest rate corridor mechanism for short-term interest rates requires a larger balance sheet size. Currently, the Federal Reserve through the excess reserve interest rate (IOER) and overnight repurchase agreement convenience rate (ON RRP) constitute the upper and lower limits of the federal funds rate, built an interest rate corridor mechanism, and is likely to build a real interest rate corridor mechanism, and interest rates The premise of the corridor mechanism is that the central bank can borrow almost unlimited money at a certain interest rate level. Bernanke believes that the current demand for reserves in real financial institutions remains at about $1 trillion and grows with economic growth. In addition, due to the current low interest rate level, once the US economy encounters a large negative impact, the federal funds rate will soon hit the "zero interest rate floor" and once again face the "Bernanke problem." To this end, the Fed will still have to resume the principal reinvestment plan and even re-expand its balance sheet. Considering the need for $1.5 trillion in cash and $1 trillion in reserves, the Fed’s balance sheet needs at least $2.5 trillion. Moreover, as the economy grows, this size will reach at least $4 trillion in 10 years. Once the quantitative easing policy needs to be restarted, the size of the Fed’s balance sheet will expand. Third, the Fed’s balance sheet needs to match the financial situation of the United States. After the financial crisis, due to the decline in tax revenue and the federal government's fiscal stimulus, the US federal government debt has increased significantly to the current size of about 18 trillion US dollars. Among them, the Fed holds about 2.5 trillion US dollars of national debt, accounting for the proportion of total debt. Once the government debt defaults, it will bring great confusion in the financial market, and will also seriously threaten the realization of price stability and full employment goals. Therefore, even in countries with independent monetary policy, in order to maintain fiscal sustainability in the context of high government leverage, the central bank has to implement debt monetization or maintain a low government bond interest rate policy. Therefore, it can be foreseen that with the deterioration of the US financial situation, the size of the national debt held by the Fed is difficult to be drastically reduced, which determines that the Fed’s contraction will be very limited. Therefore, in the future, the normalization of the Fed's monetary policy will adopt a strategy of raising interest rates and shrinking at the same time, and with the theme of “increasing interest rates and supplementing the table,†the scale of the contract will be limited, and the US financial market will remain mobile in the future. Sexually rich or even surplus. In the case of ample liquidity or even excess, after the short-term contraction led to the term premium and then the long-term interest rate rise, the "Greenspan Mystery" will repeat itself and will stimulate the new US asset bubble. After the global financial crisis, the balance sheet of the US household sector has been repaired, and the leverage ratio of the household sector has also fallen sharply before the crisis. Therefore, it is unlikely that US real estate will reproduce the bubble. But what is even more alarming is the US stock market. US stocks have recently reached new highs and their P/E ratios are rising. Robert Schiller's CAPE price-earnings ratio shows that the S&P P/E ratio has exceeded 30 times, second only to the level of the Great Depression and the Internet bubble (Figure 7). At the same time, the US VIX panic index is at an extremely low level. Schiller recently said that the high price-to-earnings ratio under low volatility may indicate a potentially large downside risk for US stocks. This may also have an impact on the US economy and even the global economy. It is the place where the Fed’s “reduction of the table†is the place where it is. However, the more the “small mouseâ€, the more likely the US stock market will expand until it develops into “grey rhinocerosâ€. Figure 7 Standard & Poor's P/E ratio Stripe With Stud For Carpet Pvc Stripe With Stud For Carpet Pvc,Plastic Rug Protector,Plastic Chair Mat For Carpet,Plastic Carpet Protector Mat Taizhou Ruihu Plastics Co.,Ltd , https://www.tzruihu.com